Cahill 1909
Cahill-Keyes 1975
|
Cahill 1909
|
Go back to
Gene Keyes home page
Cahill-Keyes 1975 |
|
Why Cahill? What about Buckminster Fuller?
Evolution of the Dymaxion Map: An Illustrated Tour and Critique Part 3 by Gene Keyes 2009-06-15 Summary: I
love Bucky, but Cahill's map is a lot better. Here's how.
CONTENTS Click inside boxes to open other sections in separate windows. |
|
Part 3
1944: The Second Dymaxion Map: Cubo-Octahedron with Whole Continents By 1944, Fuller had produced a revised version
of the cubo-octahedron, this one re-oriented so as to show all
the continents unbroken, and with the poles no longer centered
in the squares. In February 1944, he applied for a patent setting
forth both variants of the cubo-octahedron; it was granted in January
1946. Meanwhile, in April 1944 he published an article, "Fluid Geography",
in American Neptune magazine, showing the new whole-continent
version. (p. 119-136). At this time he was still calling the cubo-octahedron
figure by his own trade-name, a "Dymaxion", (or alternately, a "vector
equilibrium"), which practice he later dropped.
I have not seen the American Neptune original. It was reprinted as "Fluid Geography" in Fuller's 1963 anthology Ideas and Integrities — except that it was illustrated with the later icosahedral redesign of 1954, not the actual 1944 version which Fuller is describing in that article! The correct illustration is probably Fig. 3.2 below, which was separately reprinted in The Dymaxion World of Buckminster Fuller (1960). Robert Marks is the editor of both books. Fuller's anthologies are often a confusing patchwork of cut-and-paste. So in order to re-match the 1944 text with the 1944 illustration, I am excerpting some of "Fluid Geography" below, but only those parts describing the map itself, (The rest of the article is one of Bucky's sweeping historical narratives.) The full eight-page patent is reproduced in Part 4 Here in Part 3, I show the revised whole-continent 1944 cubo-octahedron, as seen in the patent, and then in three other reprints dated 1946; one of them, Fig. 3.2, as mentioned, likely from American Neptune, 1944. |
| Fig. 3.1 below: Illustration
from his patent 2,393,676, filed 1944-02-25; granted 1946-01-29.
Notice that in this instance, Fuller has eliminated the graticule,
and depicts only what he calls a two-way and three-way grid of
great circles. |
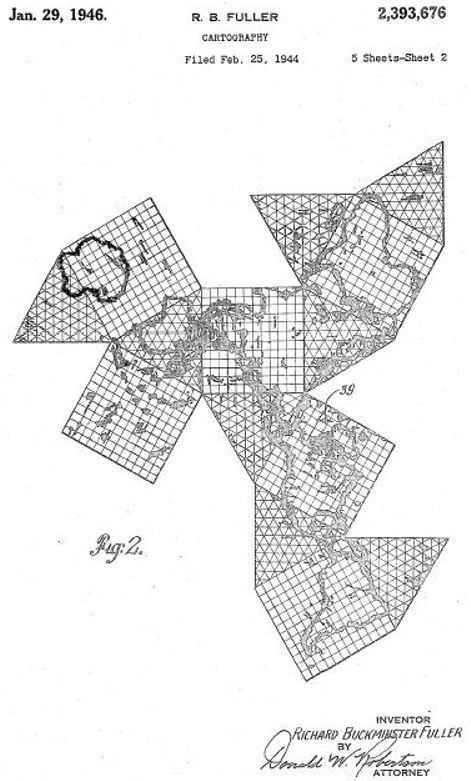
Source: Cartography Patent pdf, as downloaded via Google Patent Search; illustration converted to jpeg from pdf and enlarged to 125% by Gene Keyes. (Entire patent in Part 4.) |
|
Fig. 3.2 (below): Notice that in
the next print, Fuller has restored the graticule, but overlapped it
with his great-circle grid. The graticule is now diminished from 5°
the previous year, to 10 x 15°, and no longer shows up on any
land areas. The latitude-longitude numbers have been removed, and now
every single facet has a unique graticule, unlike the 1943 version.
It is the trade-off in order to achieve uninterrupted continents: besides
disparate graticules, the equator no longer tracks the diagonal of the
four non-polar squares. This Fig. 3.2 seems to be the correct illustration
for "Fluid Geography" (1944) excerpted here in Part 3. (More comments below,
and also within the "Fluid Geography" excerpts.)
|
For a smaller size of this picture, click in it once; to restore
full size, click in it twice.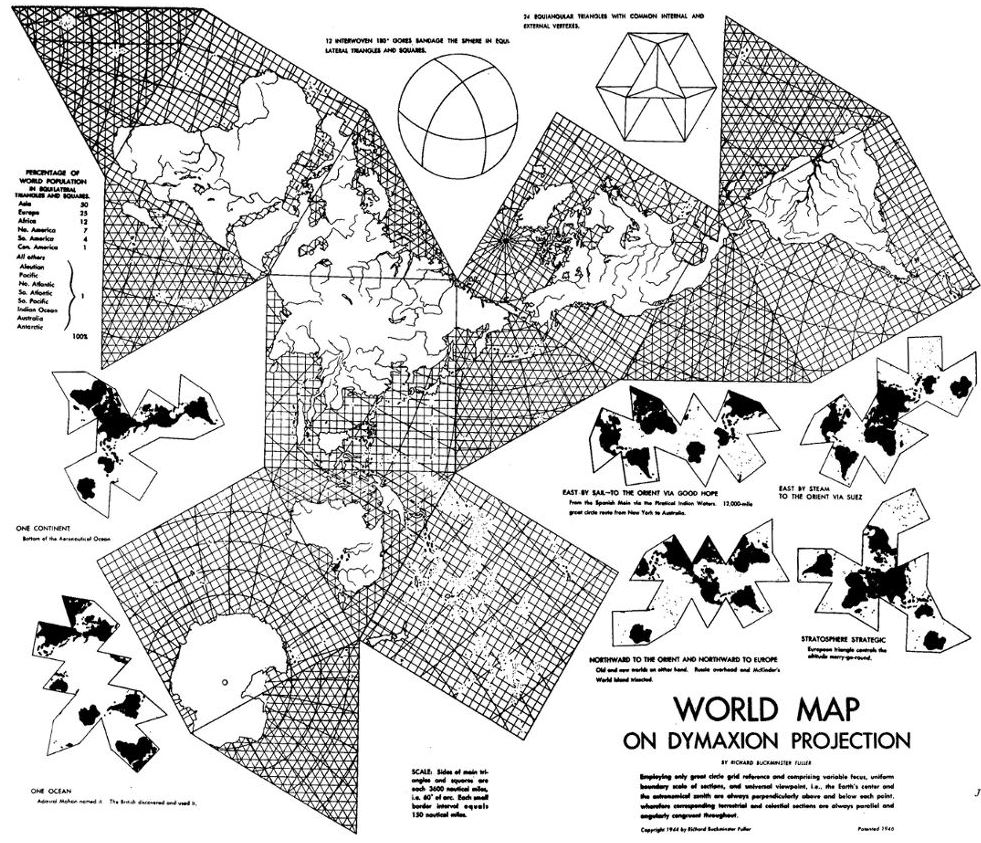
|
Fig. 3.2 above (comments, cont.):
The adjoining Marks-Fuller caption in the book (p.145)
is typical of repeated mis-statements about the Dymaxion map:The 1944 edition of Fuller's Air Ocean World Map which displayed for the first time on one surface all the world's geographical data without visible distortion of the relative shapes or sizes and without any breaks in any continental contours. . . . a) It was Cahill in 1909 who did all of the above, for the first time. b) The Antarctic contour is broken; necessitating Fuller's later split of an icosahedral triangle in order to re-assemble Antarctica, for the 1954 version of his map. (One could quibble that Cahill, too, did not show a united Antarctica in his map; but I have corrected that shortcoming in my version of his octahedral map; also at the page-top images.) And, Cahill, too, had displayed numerous different assembly patterns of the octants. Meanwhile, nearly illegible as reprinted in the
book, the caption on the map itself reads:
Source: [Buckminster Fuller and] Robert Marks, The Dymaxion World of Buckminster Fuller*, (N.Y.: Reinhold, 1960), p. 144. scanned by Gene Keyes, and enlarged to 1/92,600,000 [on my monitor]. Original's dimensions, source, and context unknown to me: 1946 reprint probably from April 1944 American Neptune. It is my educated guess that I have restored the original size, because its equatorial scale is the smaller 1/100,000,000, due to the 100 mm length of the squares' diagonals. However, the principal scale is according to the edge length of the facets. See further discussion of this point in Part 8.
|
|
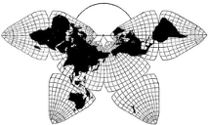
Fig. 3.3 below: Here is a different 1946
print of the 1944 Dymaxion Map, with a population chart instead
of the inset map variants.
|
For a smaller size of this
picture, click in it once; to restore full size, click in it twice.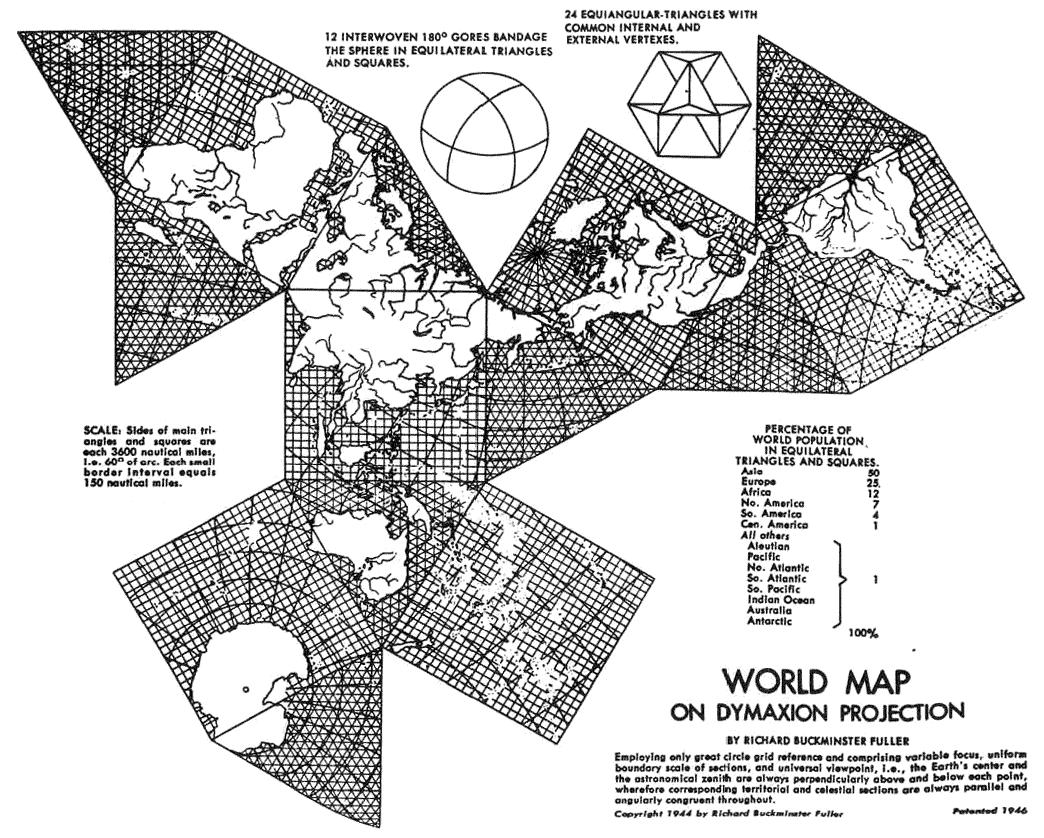
Source: from web page "Mapping the World Grid" by David Hatcher Childress; image URL itself Original's dimensions, source, and context unknown to me; reproduced here as found on Web. Scale determined by GK is 1/92,600,000 [on my monitor]. See source note above under Fig. 3.2 regarding size and scale. |
|
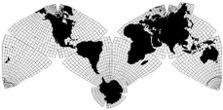
Fig. 3.4 (below): Another variant of the
1944 cubo-octahedron: this one has removed the great circle grid,
and once again we see the partial 15° graticule in its own
right. We also see that besides Antarctica, this map also splits Cuba
and Spitsbergen (home of the Svalbard Global Seed Vault).
|
For a smaller size of this
picture, click in it once; to restore full size, click in it twice.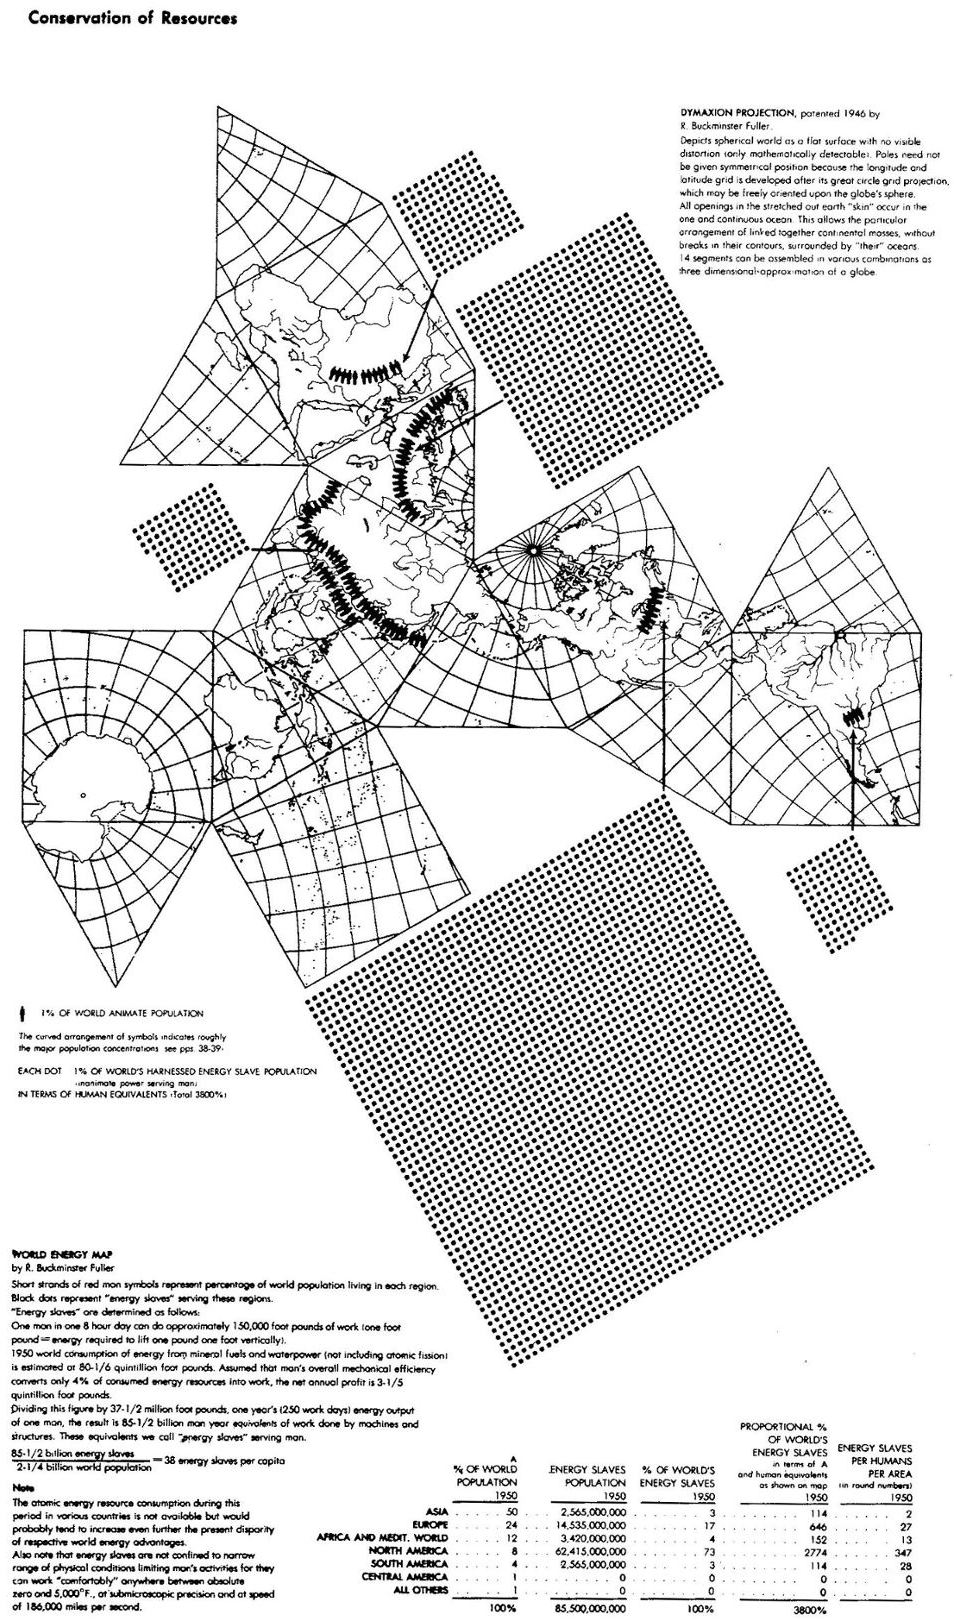
Source: [Buckminster Fuller and] Robert Marks, The Dymaxion World of Buckminster Fuller, (N.Y.: Reinhold, 1960), p. 146. scanned by Gene Keyes, and enlarged to same size as Figs. 3.2 and 3.3 Scale determined by GK to be 1/92,600,000 [on my monitor]. Original's dimensions, source, and context unknown to me. See size and scale note under Fig. 3.2 |
|
Fig. 3.5 below: Bucky on the floor with
what appears to be his 1944 version of the Dymaxion Map, and
its origami look.
|
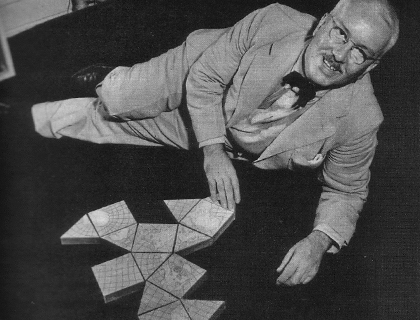
This is one of three unsourced photos
from an unnamed UCLA design student on an undated web page. His two other
pictures (dividing those in Part 2, Fig. 2.6) are from Life
of March 1, 1943, so I surmise this photo is of similar vintage*.
Source: http://users.design.ucla.edu/~djvmc/24/bucky/map.html
[Re]-enlarged to 119% by GK. *The student may have the year wrong, saying "1937", which seems to confuse the date of Fuller's Dymaxion Bathroom, also discussed there, with that of the Dymaxion Map. However, Fuller in a 1974 article states that he first showed the map to an unnamed Head of the Mathematics Department at Haverford College in 1936, and that the professor's children were playing with its pieces on the floor. But he also [mis?]-states that the tiles were "triangular", and arranged "icosahedronally". whereas Fuller did not adopt the icosahedron until 1954. (Fuller, "Remapping Our World", Today's Education, 1974-11/12, n.p., [8 p.] Its Dymaxion Map illustration was a misprint which omitted New Zealand.) Furthermore, from 1934 to 1940, Fuller had only produced what I call his "pancake" map, a non-polyhedral model shown further below. |
|
Map description from "Fluid Geography"
by R. Buckminster Fuller as reprinted in Fuller, Ideas and Integrities, Robert Marks, ed. (Toronto: Collier-Macmillan, 1969; orig. Prentice-Hall, 1963.) p. 119-141. Source not given in book, but orig. [American Neptune, April 1944, p.119-136.] Excerpted and reformatted in HTML by Gene Keyes (p. 122-125, 135-141) Remember that its Dymaxion map descriptions
refer to Fig. 3.2 above. —GK
... with historical events accelerated from a
frequency interval of centuries to intervals of hours, all men are, so to
speak, now in the same boat and are necessitous, among other items, of a
precise means of seeing the world from the dynamic, cosmic, and comprehensive
viewpoint.
[The Dymaxion Map] was invented for this purpose,
and while it is certain to be bettered by subsequent inventions
(it is for the moment the most reliable comprehensive projection)
it describes the earth's surface with the minimum total score of
distortions from the many well-known geometrical processes inherent
in translation of the angle and scale information from a spherical
to a flat surface.
Presently, we will discover why distortion is at a minimum. The mechanics of this projection, for those who enjoy inspecting the intricacies of the engine room, will be exposed toward the close of this article. The mathematics will be found to be as neat and stark as the buckets within a turbine casing. But for the moment what is important is that the trend forecaster can rely implicitly upon the impression of shapes and relative sizes and distances to be derived from this comprehensive device. We may, therefore, proceed at once to ascertain the inherent advantages and make trial of their ability to reveal major trends in world affairs. This new projection is particularly successful
because it makes possible the reassembly all on one plane of
each and any of the continents without broken contours. Further,
it makes possible the asscmbly of those whole continents in any
of the arrangements in which they occur relative to one another on
the globe, as one explores successively the infinite number of great
circle continuities. This new map is unique in that the continental
contours are transferable in unbroken integrity from their spherical
disposition to the flat map representation without perceptible deformation
or modulation of size and with uniform scale measured in great circle
arc segments bounding each component section.
Unblemished by the peripheral sinuses nccessary, first, to the scoring open and, secondly, to the peeling of any solid, this continental contour integrity is the joint result of a new mathematical discovery on the one hand and, on the other, of emancipation from the formal cartographic tyranny traditionally imposed by the Poles. (1) (1) In the March 1, 1943, issue of Life I published a world map on the dymaxion projection, with thermal latitudes shown in color. The dymaxion grid was there oriented from the North Pole, placed symmetrically at the center of a square, and the Greenwich meridian cut across the square at 90° This was irrespective of the favor to the land masses (obtained in the map published in the Neptune), Life deeming it essential that its readers recognize the familiar polar landmark which none of them had ever seen. [GK note: at this point, Fuller describes three earlier sketch maps he had published, in 1927, 1938, and 1940 but not included in Fluid Geography, so I am scanning and inserting them right here from other sources, cited below. Normally, I prefer rigorous chronological order, but I do not regard these prior maps as formal antecedents of the Dymaxion Map: that is, complete with graticule and polyhedral framework.] |
|
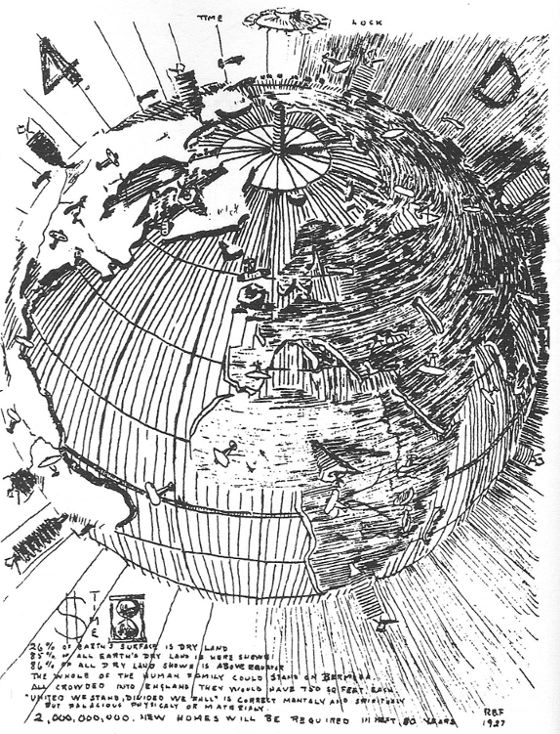
Fig. 3.6 below: Illustration of air-delivered
housing around the world, from Fuller's 1927 mimeographed book Time
Lock.
Source: scanned by Gene Keyes from p. 10 of R. Buckminster
Fuller,
50 Years of the Design Science Revolution and the World Game (Carbondale: Southern Illinois University; prepared for Joint National Meeting of the Operational Research Society and American Astronautical Society, Denver, Colorado, 17-21 June 1969) Also printed twice in Marks and Fuller, Dymaxion World of Buckminster Fuller, (op. cit, at Fig. 3.2 above), p. 73, and p. 141. |
|
|
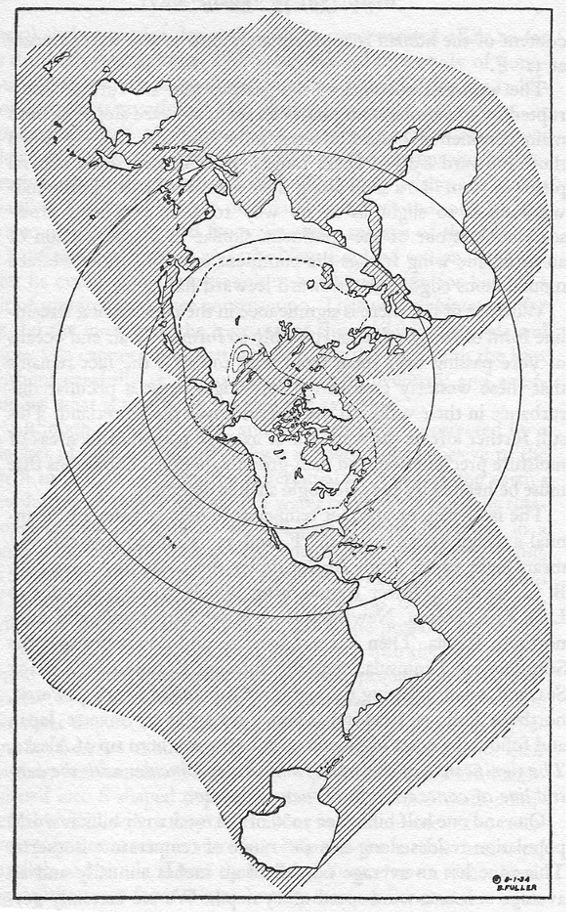
Fig. 3.7 below: In 1934, the same year
as Cahill's definitive "A World Map to End World Maps", Fuller had drawn this
proto-map, published in his 1938 book, Nine Chains to the Moon.
Unlike the 1963 reprint, the first edition also had it as endpapers.
(I'm tempted to nickname it the "pancake" map, because my pancakes
tend to have odd shapes and run together like that.)
Source: Fuller, Nine Chains to the Moon (orig.
1938;
abridged reprint 1963, Arcturus; this one, Southern Illinois University Press, 1969, p. 54 Scanned and [re-]enlarged to twice its book-page
size by Gene Keyes, 2008-04
Also shown 3 times smaller in Marks and Fuller,
The Dymaxion World of Buckminster Fuller, (op. cit, at fig. 3.2 above), p. 142, without the "8-1-34" copyright date |
|
|
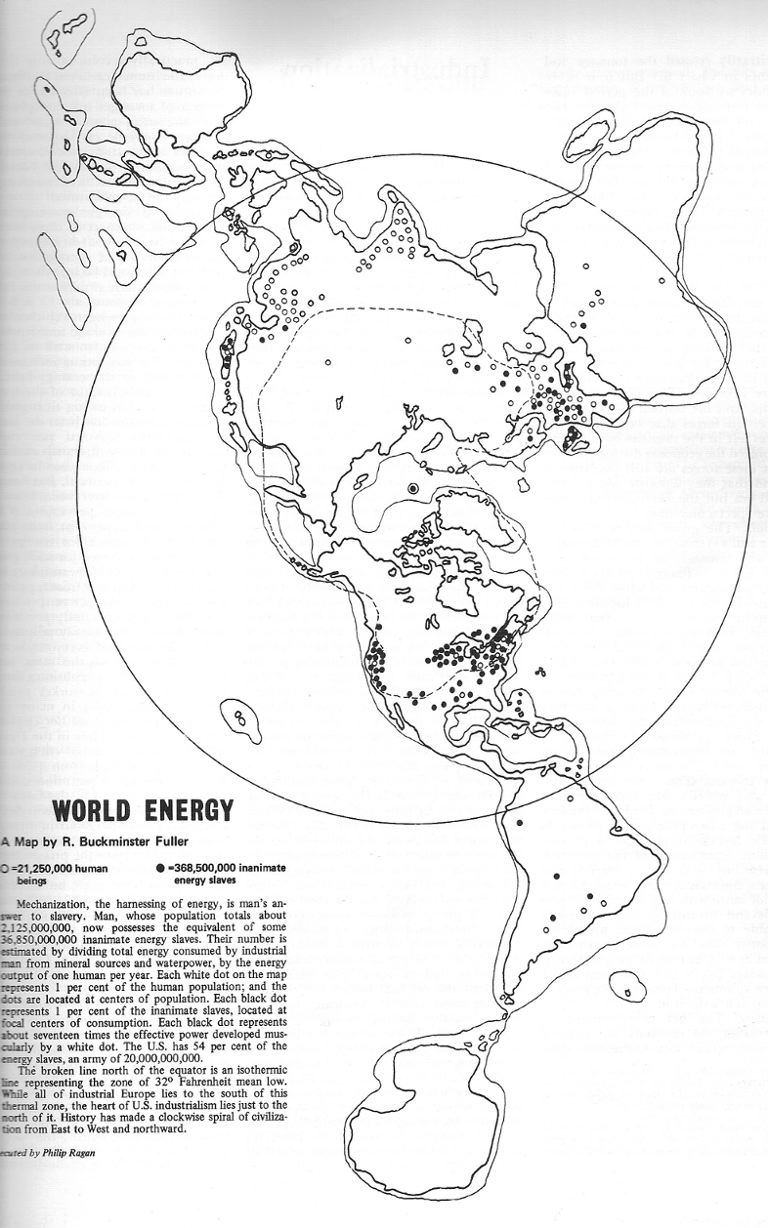
Fig. 3.8 below: 1940 version of Fuller's
pre-Dymaxion map, printed in Fortune, Feb. 1940. Global population
has tripled since then; Fuller's World Game maps of the 70s and
80s continued his practice of showing population distribution by
dots.
Source: scanned by Gene Keyes from p. 55 of R.
Buckminster Fuller,
50 Years of the Design Science Revolution and the World Game (op.cit., at Fig. 3.6 above) |
|
[GK note: we now return to excerpts from Fluid Geography, still in the middle of Fuller's footnote, describing those three maps above.]
As indicated in the miniature arrangements surrounding
the large map [GK note: Fig. 3.2 above],
there are many alternate assemblies, the components of which always
total up as a complete map of the world. Each, by "picture psychology,"
focuses attention on the central portion of its mass, yet retains
all other factors in appropriate contributory status. For instance,
one of these pictures is the sailorman's One Ocean World, fringed by
the shoreline fragments which are his particular concern. It discloses
the relative vastness of the Pacific and emphasizes that ocean's longest
axis, from Cape Horn to the Aleutians. Oriented about the Antarctic, the
waters of the Indian and Atlantic Oceans open out directly from the Pacific
as lesser gulfs of the one ocean.
To convince himself that picture psychology is not an esoteric mystery of painters, the reader has only to compare the impressions derived from looking first at the one-continent arrangement and then at the one-ocean assembly. Turning away and reporting his impressions, he would be inclined to testify that these maps were composed of different components; that the one-continent map was comprised of seventy-five per cent dry land area, that the one-ocean map was comprised of ninety per cent water area. The fact is that both maps are composed of the same pieces. Though less dramatic than the example presented, the many other possible arrangements are endowed with equally unique psychological differences. Each of the arrangements is as important as any other, depending upon the geographical location with which the individual has habitually been identified. The sailor may ascertain by inspection the most advantageous courses to his many world ports from the tactical center of thatwatery workaday world. So far as he is concerned, the whole world is one ocean, one-quarter of whose uneven bottom crops up through the surface in peaks and plateaus. When he comes in to the shore, he is coming in to the peak of a mountain range about five miles high. To our modern cosmic sailorman, coming in to an airfield in Tibet over the Himalayas is approximately the same sensation as coming in to Puerto Rico over the Antilles ranges, rising abruptly 30,000 feet above the Nares Deep. There are also many rearrangements of the map to emphasize whole continental masses. By means of these elective arrangements, our thinking may be realistically insinuated within the special geographical environment of the people of anyone world area as predicated upon their own set of conditions of direction and proximity to all the rest of the surrounding world. It is in this feature that we discover the dynamic leverage afforded our world appraisal by this device. No longer need the American contInents, for instance, with only twelve per cent of the world population, occupy relentlessly the central and non-distorted portion of the world map, assigning fifty-two per cent of the world's population to an insignificant, fragmented, and distorted Asiatic borderline position. In the particular assembly chosen for the large display, one sees all the continents linked together without visible distortion, without a break in their contours, for the first time in history. ***********************************
Preposterously distorted in its polar regions,
Mercator's cylindrical map, tangential at the Equator, was none
the less preferred by the sailor to the globe. He found Mercator's
map could be unrolled to represent the whole world. So long as man's
comings and goings were centered within the warm belt girdling the
Earth at right angles to its axis, the Mercator map was a pretty satisfactory
affair. But as suddenly as cities have been wiped out by air bombings,
there has come upon the people the necessity for seeing the world as vividly
as the sailorman has. Suddenly, within months, people have come to realize
that they can girdle the planet in an infinite number of directions.
The world has been surprising itself by coming in its own back doors
and down its own chimneys from every unlooked.for direction. This has
called for a revolution in map making and in cartographical principles
such as history has never seen. A need has risen for new methods of peeling
data off the globe and for assembling the peelings in such a manner as
to gain useful knowledge of the spherical coursings.
While still imbued with the static pictures and the traditional thinking, people viewed the first appearance of the new maps as a novelty. Any inclination to comprehension of the relative merit of the different maps as a result of comprehension of the principles by which they were constructed was thrown into utter confusion by the welter of pedagogic terms. Sinusoidal, conformal, azimuthal, gnomonic, orthographical systems, scared the layman away from making criticism of the appearance of Australia as a kidney bean three times the size of South America. Feeling the progressive urge to global comprehension, he produced a mass market for commercial globe manufacturing, but after a few swift inspections, these were relegated to decorative functions from their role as daily tools. Much more important to him were the newspaper maps of the daily war scenes. Out of the newspapers and the novelties, people are beginning to see that there are some interesting new angles and proportions. Unfortunately, most landlubber cartographers prefer to impress people with the difficulties and aesthetics of their art rather than with implications of the dynamic geography of a world.industrializing people. People are catching on that great circles constitute the spherical straight line and that there is an important continent at the Antarctic and not a jagged, icy fringe along the bottom of an east-west Mercator layout. This advance in popular awareness is despite the fact that during World War II the traditional suppliers of maps provided streamlined equatorial Mercator world maps for all the allied war offices and accessory bureaus, upon which maps the ocean distances between Greenland and England appear greater than those between Tokyo and San Francisco. People are learning that "via the North Pole" is the shortest great-circle distance from America's midst to the center of population of the world. But when they were told during the war that Tarawa represented the first major gain in the direction of Tokyo, they were not well enough versed in their geography to realize that announcement that the Marines had taken the North Pole would have put the United States closer to Tokyo's center, and that the Marines were actually farther from Tokyo than Chicago is from London. And even those professional geographers and military tacticians who did know that these were the proportionate distances by great circle, have not, unless skilled in the dynamic sailorman's thinking, realized that in the terms of the air motions which twist the great circle courses all out of shape, the North Pole is a third nearer to Tokyo than Tarawa, when full advantage is taken of atmospheric motions. Because of this latter fact, it becomes obvious
that the kind of map that static cartographers produce can only
partially educate the people—that is, up to the realistic great-circle
concept. All known traditional projection methods fall far short of
providing a comprehensive, sectional cartographical device which may
be mutably arranged in any direction in such a manner as to bring focus
to bear on any of the dynamic inter-relationships of the world's surface
affairs.
One such sailorman's mid-twentieth-century invention
is the mutable map presented here. Appropriately, its faces represent
the facets of the monometric construction shown in the accompanying
drawing, which drawing represents the vector equilibrium* of a sphere.
[*GK note: see my remarks, three paragraphs down.]
Unlike all known preceding projections, which represent transfers of spherical data to plane surfaces tangent to the sphere only at one point, as in the case of the azimuthal or gnomonic projection methods, or only along one central line, as in the case of the Mercator, or only along one or two segmental arc lines, as in the conics, this projection is one in which the coincidence with the projected sphere occurs all along the complete boundary of each section of the projection, thus retaining the unique cartographical feature of being the only projection in which uniform great-circle scale characterizes the logical terminal edge of each section to be projected, that scale being maintained intact after transfer from the sphere to the flat surface of the map. Sailorwise, this new projection is made from the cosmic viewpoint—that is, the astronomical zenith and the center of the earth always remain, respectively, vertically above and below each and every point of the surface of the cartographic data. Not only is this true in its spherical arrangement but also in its planar projection into the sections of the comprehensive map. Because the. enclosing border scale cannot be elongated, distorted or contracted, and represents a great circle bent flat into a one-dimension line, the adjustment of the contained spherical surface segment to a plane surface segment must be satisfied by interior contraction of the data instead of by exterior stretching, as in all other methods of projection. Because of this feature the several pieces fit neatly together, being the mutual sides of adjacent polygons and being separated by the same great circle or straight line. Because the area of a circle increases as the square of its radius, the same error outwardly disposed must be distorted to four times greater extent than by inward disposition. * [GK note: the paragraphs which follow have a critical argument, which would be lost on readers of the book reprint, given its incorrect icosahedral illustration on p. 139. (Also, remember that in 1944, Fuller was still calling the cubo-octahedron by his own trade name of "Dymaxion", as well as his other name for it, "vector equillibrium".) Notice that below, Fuller is defending the cubo-octahedron against Fisher's recent gnomonic icosahedron. I cannot say whether Fuller's mathematics-of-distortion argument is apropos; but, when Fuller himself switched to the icosahedron in 1954, the accompanying broadsheet on the projection (reprinted in Part 5) also contained a partial reprint of "Fluid Geography", which omitted the rest of the article from this point on, including its anti-icosahedron passage.] The segmentation of the earth's surface into eight
triangles and six squares is not in any sense a matter of esthetic
choice. It represents one known subdivision possible by means of
this universal-projection viewpoint, for the radial and chordal lengths
must be identical in order to allow this symmetrically hinged opening
of the sphere.
Having six axes and four dimensions, its parts may be rearranged to unpeel the globe continuously in all directions. Gnomonic projections through the surface facets of any of the regular polyhedrons will serve to provide a variety of sectional world surface maps. Striking an optimum between angular contractlon and numbers and sizes of pieces, an icosahedron is the least distorted, for these projection purposes, of any of the regular solids. However, the spherical vertexes of the icosahedron's twenty triangles must be reduced from 72° to plane triangular vertexes of 60°, a reduction of twenty per cent; which percentage times the number of pieces gives the total distortion. On the other hand, the Dymaxion's fourteen pieces accomplish translation with a distortion of only sixteen per cent, the Dymaxion's spherical triangles being only 70° and the vertexes of the square bearing the same percentage relationship between the spherical and the plane figure. The Dymaxion projection method of transferring spherical data to the plane surface is extremely simple. Because of its universal viewpoint,.it need deal only with the surface of the sphere and the plane surface of the map. A lattice of four great circles is formed about the sphere, each intersecting the other in such a manner as to subdivide each circle into six symmetrical arcs of 60°. This lattice provides fourteen spherical surface areas, eight of them triangular, six of them quadrangular. These spherical triangles and squares are equilateral. The surfaces of these triangles and squares are then interwoven with great circle grids, the triangles by a three-way grid of great circles and the squares by a two-way grid of great circles. These grid lines spring from uniform scale modular subdivisions of the 60° arc sections in as fine a degree as is desired. The geographical data coinciding with these grids is then transferred to eight equilateral plane triangles and six plane surface squares. For purposes of this translation, the plane triangles and squares have been prepared as follows: Their surfaces are subdivided by respective three-way and two-way grids of straight lines. These straight lines spring from modular subdivisions of their boundaries which correspond in scale and number to the subdivisions of the original spherical arc segments of 60°. The spherical geographical data is then posted to corresponding positions in the appropriate plane grid spaces. The spherical great circle grids are thus treated as constituting straight lines in the plane geometrical surface. The principle of treating great circles and straight lines as constituting one and the same thing, effects the distribution of the angular contraction in a concentric disposition on the plane sections. The key to understanding why this method accomplishes its translation with a minimum of distortion is that it treats the 180° spherical gores in two ways. The irreconcilable conditions of convergence and parallelism, characterizing the terminals and mid-part of the 180° gores, are treated separately and symmetrically as triangles and squares respectively. All other projections..impose the advantage of one feature against the advantage of the other by trying to solve both convergence and parallelism by one. grid. These resolved gore parts of the Dymaxion map, by treating these conditions separately, allow four.dimensional unwrapping of the sphere. |
|
In 1946, 33 years after Cahill's world map
patent, always uncited by Fuller, he received a patent for the Dymaxion projection
(which expired in 1963; all his maps also bear copyright dates). Patents
are somewhat of an effort to find, even via the Internet, where they are
small-print pdf's on cluttered pages. So next I am presenting the pdf by
itself, plus a set of enlarged jpegs from it.
Buckminster Fuller's 1946 Cartography
Patent
|