LAND MAP OF THE WORLD ON A NEW PROJECTION.
185
[In this instance, the globe-circle is smaller than the others. — GK]
LAND MAP OF THE WORLD ON A NEW PROJECTION.
189
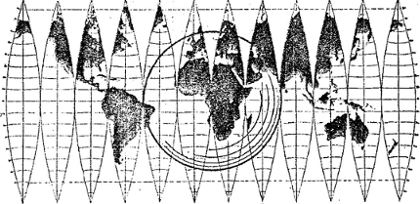
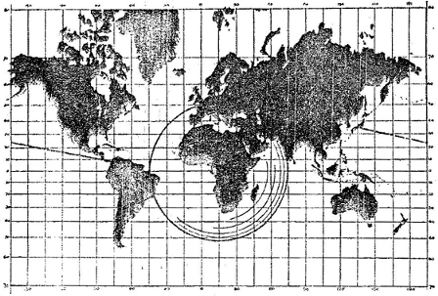
Fig. 19.
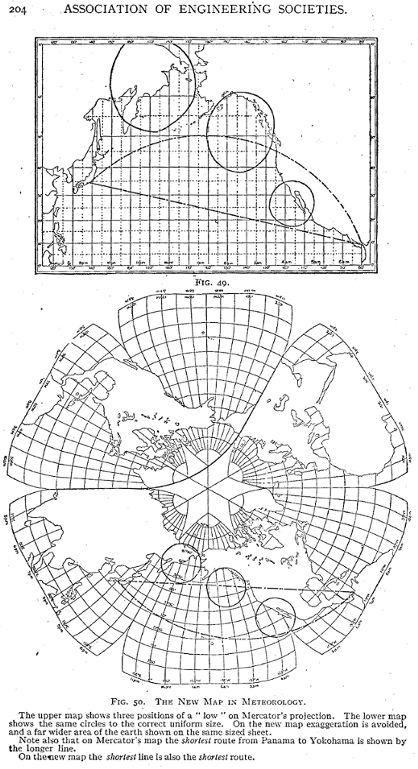
The World on Mercator's Projection.
Note the enormous exaggeration
of Alaska, Greenland, Norway, Sweden, Siberia, etc. See Fig. 49.The World on Mercator's Projection.
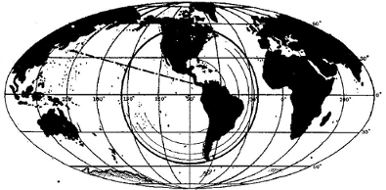
Fig. 20.
The World on Mollweide's Projection.
All the above maps are drawn to
the same scale. Both 19 and 20 are meant to represent the facts
shown in Fig. 18. Neither the rectangle nor the ellipse can be made
to cover the sphere.The World on Mollweide's Projection.
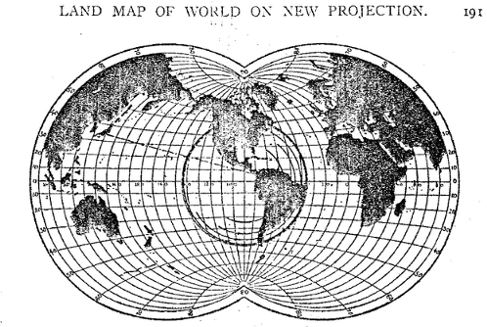
Fig. 21.
The World on Van Der Grinten's Projection.
The World on Van Der Grinten's Projection.
Note — This map is a compromise
between the exaggeration of Mercator and the distortion of Mollweide's.
But it does not remedy either defect sufficiently, while it sacrifices
the advantages of equal angles and equivalent areas which make
the first two scientifically valuable.
The above version of this projection is almost identical with one patented in England on July 13, 1889, by H.B. de Beaumont, of Geneva.
The above version of this projection is almost identical with one patented in England on July 13, 1889, by H.B. de Beaumont, of Geneva.
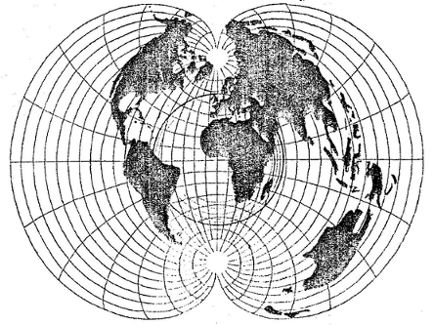
Fig. 22.
The Whole World on the Polyconic Projection.
The Whole World on the Polyconic Projection.
This projection for limited
areas is the most accurate of all. For the whole world it is practically
useless. See Fig. 10 and 48.
192. ASSOCIATION OF ENGINEERING SOCIETIES.
Fig. 23.
Polar Radial Map, Six Extensions.
Polar Radial Map, Six Extensions.
Note. This map is published
by the American Book Company, and shows both the need of a new
type of projection and the fact there is a tendency to supply the
need.
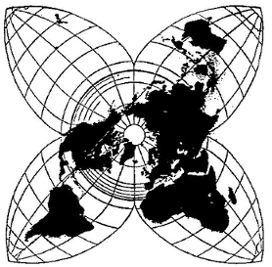
Fig. 26.
A Polar Stellar Projection with Four Extensions.
Published by J.G. Bartholomew & Co.
In this projection the gorings extend above the equator and the
world is divided below the equator into four parts, a decided improvement
on all preceding maps of this type to date.
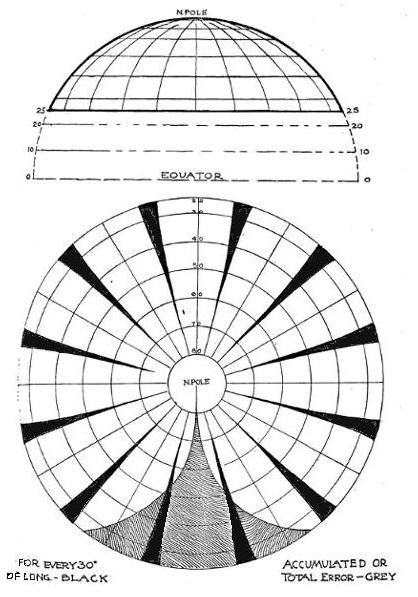
Fig. 27.
Showing necessary distortion of a polar
map carried down to 25° north latitude, as in the projection
shown in . Fig.26.
Note: this is a larger version of the same illustration as used in Cahill's 1909 article in the Scottish Geographical Magazine, with Xerox black-fade somewhat corrected by GK. (Figure's left edge impaired due to binding.)
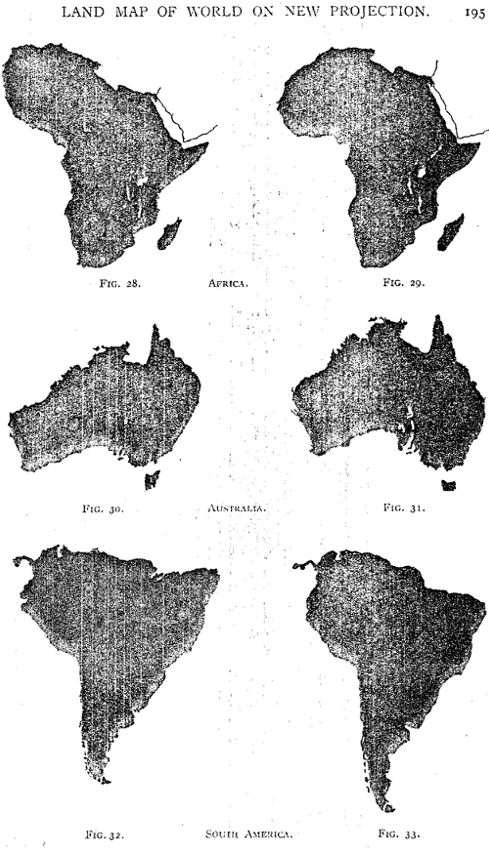
Note. — Fig. 28, 30 and 32
show Africa, Australia and South America twisted and distorted as
they come on the equal area polar map shown in Fig. 26.
Fig. 29, 31 and 33 show normal region maps of these continents to about the same scale.
When drawn on the new projection these continents assume forms indistinguishable from Fig. 29, 31 and 33. See Figs. 37, 38, 42, 43, 44 and 45.
Fig. 29, 31 and 33 show normal region maps of these continents to about the same scale.
When drawn on the new projection these continents assume forms indistinguishable from Fig. 29, 31 and 33. See Figs. 37, 38, 42, 43, 44 and 45.
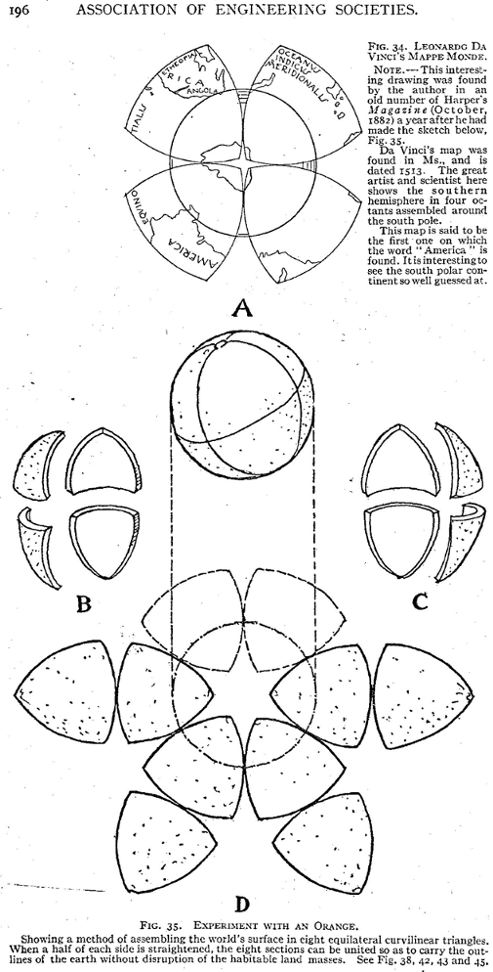
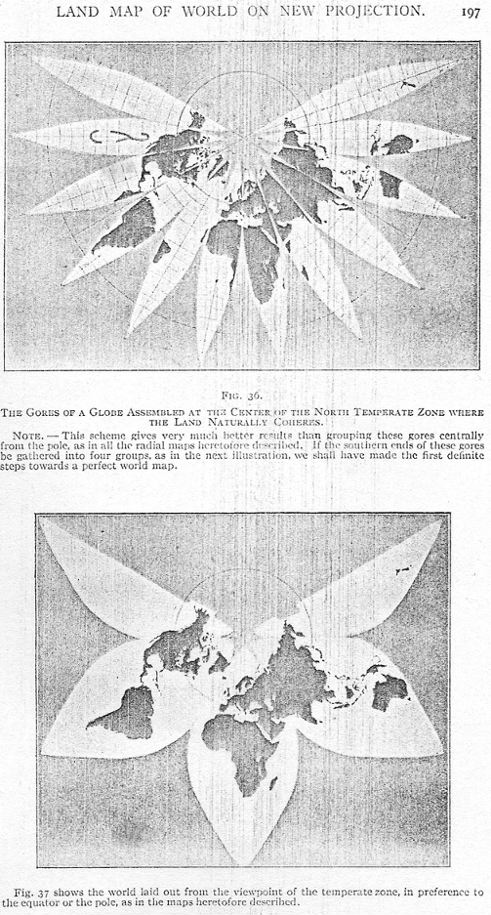
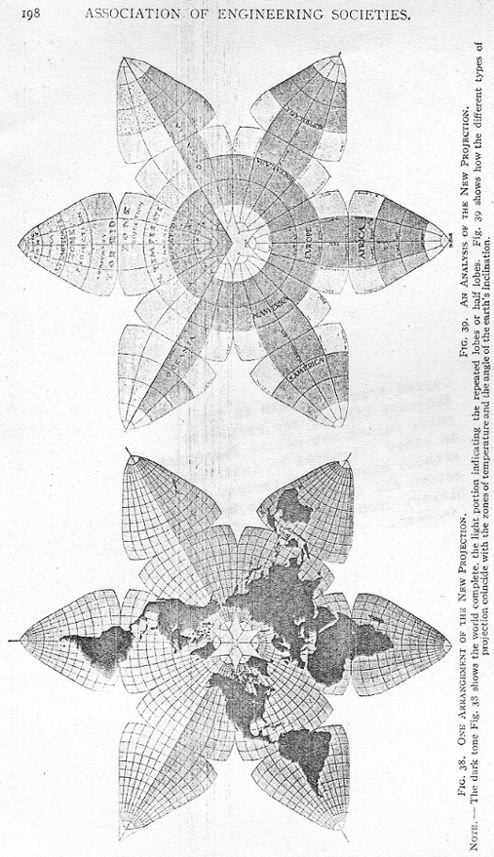
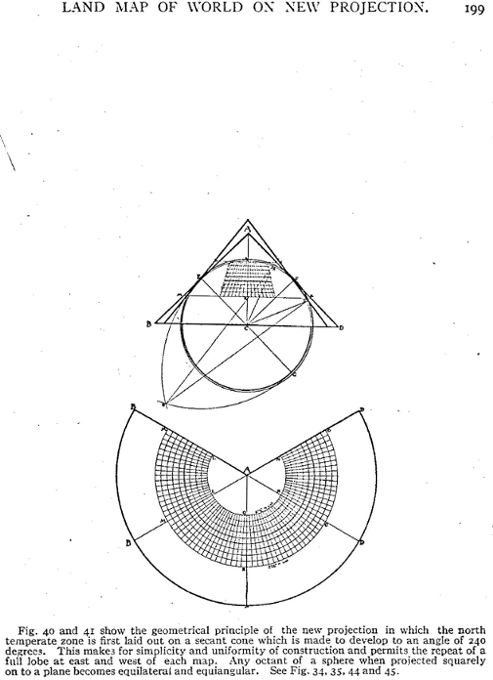
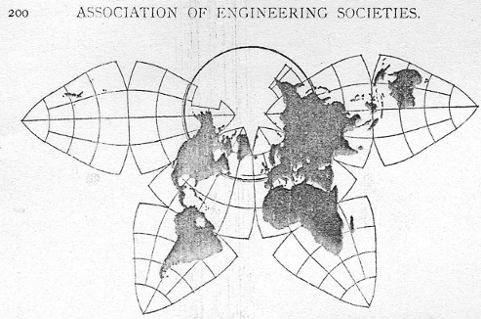
Fig. 42: The World on the New Projection.
Note — In this map the Pacific
Ocean is separated, while the Atlantic is shown complete. The clef
or key which carries Kamchatka on the right upper lobe suggests pictorially
that it is meant to fit the corresponding gap opposite Alaska.
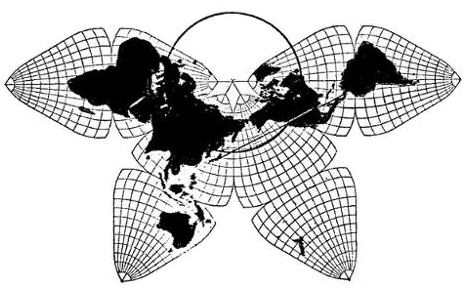
Fig. 43: The World on the New Projection.
Note — In this map the Atlantic
Ocean is separated, while the Pacific is shown complete. See Fig. 45,
which shows mechanically the method of projection.
If the map be slewed around another sixth of a revolution, and the African lobes are thrown over to join the American ones, we have the world with America in the center and the Atlantic and Pacific on either side, an excellent arrangement for school use. In all these changes the actual map-sections remain the same. Only one drawing of all parts of the world is needed, the various arrangements being merely mechanical.
If the map be slewed around another sixth of a revolution, and the African lobes are thrown over to join the American ones, we have the world with America in the center and the Atlantic and Pacific on either side, an excellent arrangement for school use. In all these changes the actual map-sections remain the same. Only one drawing of all parts of the world is needed, the various arrangements being merely mechanical.
LAND MAP OF THE WORLD ON A NEW PROJECTION.
201
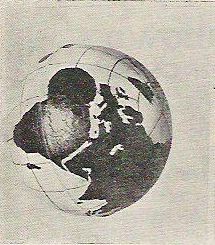
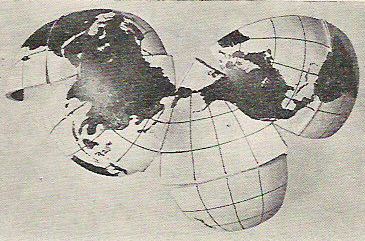
Fig. 44. Experiment With a Rubber Ball
Note — The world is drawn
on lines of latitude and longitude 22 1/2 degrees apart. When it is cut
through in six crosses at the poles and on the equator, and these cuts are
connected, the adhering lobes can be spread out into a plane and laid
flat exactly like the map, Fig. 43.
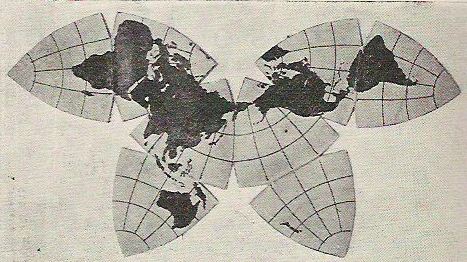
Fig. 45. Showing by Mechanical Means How the New Projection Literally Lays Flat the Surface of the Sphere.
Note — The rubber globe half
displayed in Fig. 44 is here flattened behind glass. The strain is
so slight that it does not crack the ink. When the glass is removed the
butterfly map jumps back and resumes the spherical form.
202. ASSOCIATION OF ENGINEERING SOCIETIES.
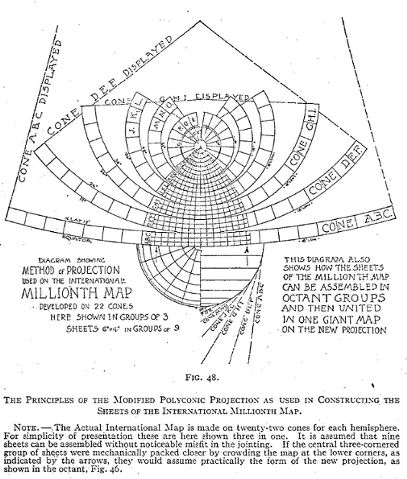
[GK note: I have added a sharper scanned photo of the large octant below, as well as a Xerox of the octant as it appears in the article, with the dotted lines indicating nine sheet sets of the International Millionth Map, mentioned in the caption below.]
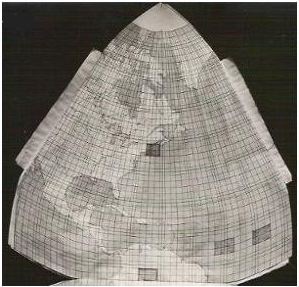
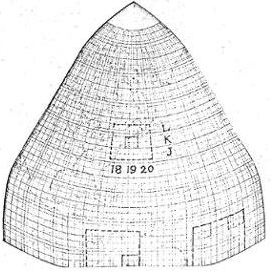
Fig. 46. One Octant of the New World Map
Note — This is reduced from
a large drawing made originally to the scale of a 36-in. globe. The
coordinates are drawn every two degrees and every fifth degree in between.
The small shaded sections show the actual positions and relative sizes
of the sheets of the International Millionth Map. The dotted spaces show
groups of nine sheets as shown on the polyconic diagram, Fig. 48.
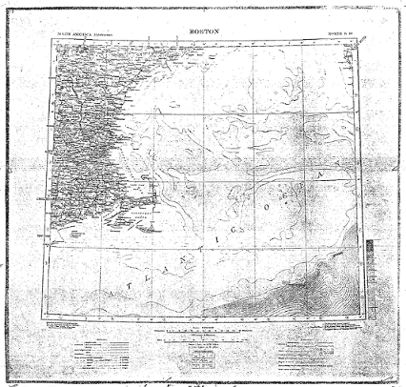
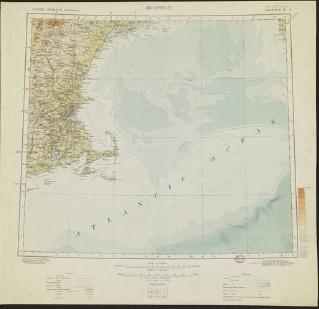
Fig. 47. Sheet "North K 19" of the International Millionth Map.
Fig. 47. Sheet "North K 19" of the International Millionth Map.
Note — The only one published
in the New World. Fig. 46 shows its actual position on the new map
and the position of the eight other sheets that go around it.
[GK note: thanks to the magic of the Internet, I am taking the liberty of adding this color copy of that same 1912 IMW N-K-19 sheet, from the Boston Public Library. http://maps.bpl.org/id/M8800/ .]
LAND MAP OF THE WORLD ON A NEW PROJECTION.
203